
Table of Contents
Trend Graph
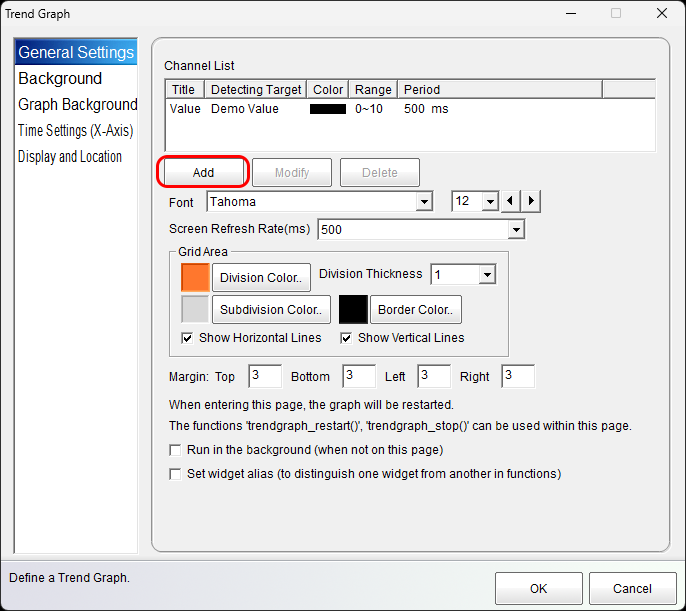
The Trend Graph widget can be used to acquire data and present it as a line graph changing with time.

General Properties

Channel List
Add and customize independently one or more data acquisition channels and their appearance.
Fonts
Customize the appearance of the text displayed on the graph.
Refresh Rate
Specifies the rate at which the graph redraws on the screen. This is independent from the data acquisition rate of the individual channels.
Grid Area
Defines the appearance of the grid lines.
Margins
Margins used to customize the position of the graph within the widget's bounds.
Run in the background ...
When unchecked, the trend graph will stop acquiring data when navigating away from the trend graph's page. When checked, the trend graph will continue to acquire data while the operator is navigated away from the trend graph's page.

Sampling initiation can be configured for when the page is first loaded or for when the trendgraph_restart function is called (or either).
Set widget alias ...
A widget alias can be assigned to the trend graph to be used as a trend graph identifier in the trendgraph_… functions.
Channel Settings

Min/Max. Value
Sets the vertical window of the y-axis.
Line Thickness/Color
Sets the thickness of the line graph and it's corresponding color.
Channel Name and Scale
Sets the text label and text scale for the y-axis.
Data Source
Choose the source of the data to plot. This can be read directly from a connected device, an expression, or a simulated value for demonstration purposes.
Use Scaling
Fit the data to the vertical window.
Data Acquisition Period
Sets how frequently the data should be sampled from the data source.
Backgrounds

The widget background can be adjusted independently of the graph background.

Time Settings (X-Axis)
Settings for the time scale (x-axis).

No. of Divisions/Subdivisions
Customizes the number of vertical grid line divisions and subdivisions to display.
Time per Division
The amount of time allocated to a division.
Label and Scale
Customizes text label and text scale to display along the x-axis.
Demo